Five market signals, one rotation
Five datapoints, all reported by Cointelegraph on 7 June 2026, sketch a more interesting picture when read together than any of them does in isolation. Short positioning against longs has reached a twelve-to-one imbalance. Total value locked across decentralised finance has shed nearly $100 billion since October 2025. Some $2.4 billion in USDC has walked out of circulation in thirty days. US small-business hiring is on track for its weakest reading since May 2020. And the Ethereum staking queue is running 1,261 times deeper on the entry side than on the exit. Each is a mood ring. Together, they describe a rotation.
The claim
That rotation is the real story. It is not a crash in the cinematic sense, and it is not a panic. It is a quiet withdrawal — out of risk, out of dollar liquidity on the crypto on-ramp, out of optimism about the small-firm labour market — that has been underway for several months and is now producing unambiguous prints on the data. The signal is most visible in the plumbing, which is where plumbing data is most useful: in the days before the headline writers catch up.
The positioning, and what it hides
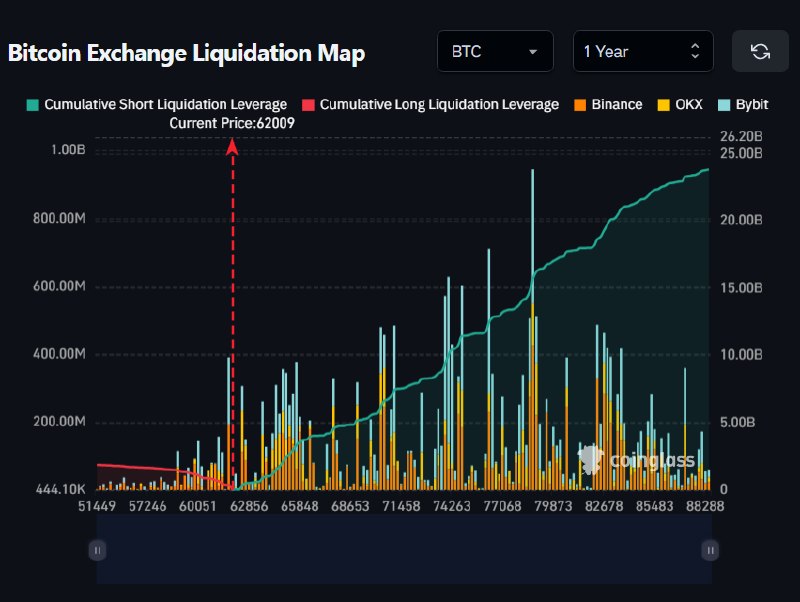
The positioning data, as reported at 20:31 UTC on 7 June, shows there are now twelve times more shorts than longs in the market. A ratio that extreme is rarely a confident directional thesis. It is more often a leveraged trade designed to harvest carry, basis, or funding on a market that, in isolation, looks structurally short-friendly. Crowded short books, however, are also a setup. They create the conditions for a short squeeze if even a modest catalyst arrives — a softer inflation print, a Fed speech, an unwind in one of the more levered desks. The asymmetry is that crowded shorts bleed slowly while a squeeze punishes them in a single session. The data does not yet tell us which side resolves first. It does tell us that the trade is unusually one-directional.
The DeFi retreat, and the stablecoin tell
The DeFi picture is slower-moving and arguably more informative. Total value locked across decentralised finance protocols is down almost $100 billion since October 2025, per the same wire. That is roughly a quarter of the entire DeFi complex being withdrawn or migrated elsewhere — to other venues, to other chains, or, more plausibly, back into the dollar system. The most plausible explanation sits on the yield curve. The rate environment has remained restrictive for longer than the consensus expected in late 2025, and the marginal incentive to park capital in on-chain lending protocols or liquidity pools has compressed accordingly. DeFi, stripped of its rhetoric, is a leveraged bet on the spread between on-chain yield and risk-free dollar rates. When that spread narrows, the bet shrinks.
USDC supply, in turn, is the cleanest real-time gauge of how much dollar liquidity is sitting inside the crypto on-ramp. The 11:48 UTC report on 7 June flagged that $2.4 billion had left circulation in the past thirty days. USDC is minted when dollars come onto the on-ramp and burned when they leave. Net burning means dollars are heading somewhere else — into bank deposits, into stablecoins backed by other issuers, into traditional risk assets, or simply into cash. The dollar is not exiting crypto because of any one shock; the on-ramp is just less attractive than the alternatives in the current rate environment. That is the read, and it is consistent with the DeFi number above it.
The labour signal, and the staking one-way door
The labour signal sits outside crypto but rhymes with it. The 01:34 UTC report on 7 June noted that US small-business hiring is expected to fall to its lowest point since May 2020 — a useful historical anchor, because the May 2020 reading was the trough of the pandemic shock. The small-firm hiring series is one of the more reliable forward indicators on the US labour market, precisely because small businesses cannot absorb a demand shock the way larger employers can. They are the canary, not the miner. If small firms are pulling back on hiring in the way the data suggests, consumer-facing demand is forecast to weaken over the second half of 2026, with knock-on effects for everything from retail to consumer credit to, eventually, risk-asset multiples. The crypto data is downstream of that. So is much else.
The staking data is the contrarian note. At 23:31 UTC on 6 June, the wire reported that there is 1,261 times more ETH queued to stake than to unstake. On its face, this looks like conviction: holders are locking up rather than cashing out. Read more carefully, it is also illiquidity. Once ETH is staked, the queue to exit is measured in weeks, and the imbalance at the queue is 1,261 to one. That is not just bullish; it is a one-way door. If the broader risk-off environment accelerates, staked ETH cannot move quickly enough to express the view, which is itself a form of forced longer-term commitment. Whether you read that as conviction or as a trap depends on what the next twelve months look like.
The stakes
The five signals point in the same direction: a market in which leveraged short positioning, declining DeFi TVL, contracting stablecoin supply, weakening small-firm hiring, and one-way staking queues all reinforce the same rotation. None of this is, on its own, a forecast. It is a description of how capital is currently arranged. The interesting question is not whether the rotation continues but what would interrupt it. A clearer dovish signal from the Federal Reserve would change the calculus on the DeFi spread and the USDC demand in a single move. A short-squeeze catalyst would reset the positioning. Absent one of those, the underlying drift of capital is doing what the underlying drift of capital does: moving from speculative to defensive, and from on-chain back into the dollar system that anchors the price of every other asset on the list. The chain of consequences, if the drift continues, runs from small-firm layoffs to consumer credit to stablecoin supply to DeFi TVL. None of that is set in stone, but it is the read the data is offering.
Desk note
The honest caveat is that none of these datapoints are corroborated outside Cointelegraph's wire in the source material reviewed here. The numbers are the numbers, the dates are the dates, and the directional interpretation is editorial. The signals are unusually aligned, which is itself worth noting — and which is also, historically, the moment at which the contrarian trade pays best.
Wire provenance
This editorial synthesis draws on the following public wire/social posts:
- https://t.me/cointelegraph
- https://t.me/cointelegraph
- https://t.me/cointelegraph
- https://t.me/cointelegraph
- https://t.me/cointelegraph