The Multiple Behind the Index: How Price-to-Sales Redefined the S&P 500
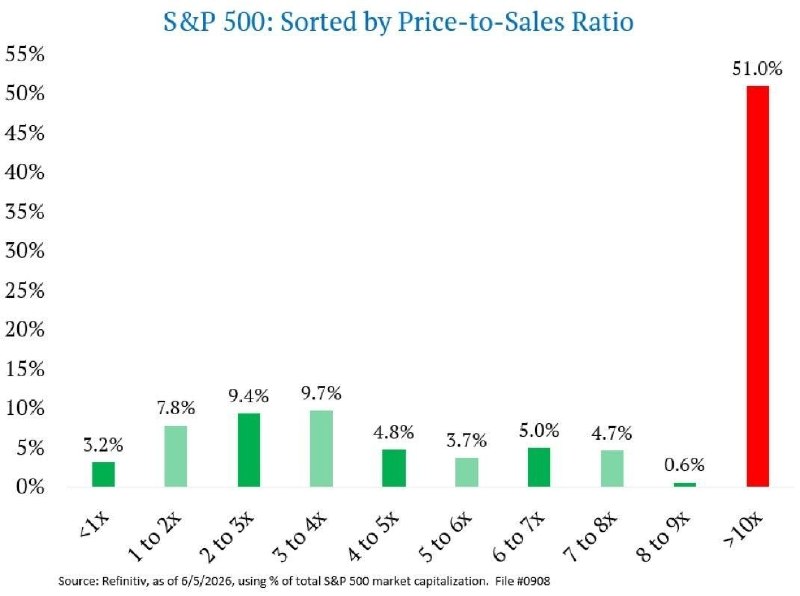
On 8 June 2026, a brief statistic circulated through financial channels that, if taken at face value, recasts the entire postwar narrative about American equity markets. According to the Telegram channel Two Majors, 51% of the value of companies in the US S&P 500 index now comes from stocks trading at more than 10x their revenue — a price-to-sales multiple that was a relative rarity in the index's modern history. The same note observed that, in 2002, when technology shares were recovering from the dot-com collapse, that share of the index was a small fraction of today's.
The figure invites two readings. The bullish one holds that the market has simply re-rated to reflect a more digital, more capital-light economy in which intangible assets — code, data, brand, network effects — generate revenue at scale without the heavy fixed costs that defined industrial-era balance sheets. The bearish one holds that the index has become a price-weighted monument to a small number of very large companies, most of them platform businesses whose revenue growth is assumed rather than delivered, and that the multiple itself has become a kind of self-fulfilling benchmark: passive flows chase the index, the index is dominated by the largest names, and those names trade on multiples that resemble growth-stage venture valuations rather than mature public equities.
Both readings rest on the same arithmetic. They differ on whether the arithmetic describes reality or distorts it.
The number, in context
Price-to-sales is a blunt instrument. It does not distinguish between a business converting 40% of revenue into operating profit and one burning cash to subsidise user acquisition. It does not price in capital structure, tax burden, or working capital intensity. It is, however, harder to manipulate than earnings — which companies can flatter through share buybacks, depreciation choices, or one-off tax benefits — and for that reason it has become a favoured tool of analysts trying to cut through the accounting fog of large-cap technology.
The Two Majors figure implies a market in which the median constituent trades at a sales multiple above the level that, in earlier cycles, would have marked the upper boundary of reasonable valuation. The 2002 comparison is instructive. In the wake of the dot-com bust, the survivors — Microsoft, Cisco, Oracle, IBM — traded at multiples that had been compressed by years of investor disappointment. The S&P 500 as a whole was cheaper, in sales terms, than it is now by a wide margin. The composition was also different: energy, financials and consumer staples carried more weight. The shift in weighting toward a small group of very large, very highly valued technology and platform names has, on its own, lifted the median sales multiple of the index without any company in particular having to become more expensive in absolute terms.
The mechanism is mechanical, not mystical. Index funds buy the index. The index is weighted by market capitalisation. Market capitalisation is share price times shares outstanding. Share price is, in the short term, a function of flows and expectations. As flows have migrated toward passive vehicles — a structural trend now more than two decades old — the largest constituents have received disproportionate buying pressure, which has lifted their share prices, which has lifted their weight in the index, which has attracted more passive flow. The 51% figure is, in this sense, less a verdict on individual companies than a verdict on the plumbing of modern equity markets.
The counter-narrative
The rebuttal is that markets are not wrong as often as sceptics claim. A 10x sales multiple is not, in itself, a sign of froth; it is a sign that the market expects the company in question to convert a substantial share of that revenue into profit over time, and to grow the revenue base at a rate that justifies the implied terminal value. The seven companies most often cited as carrying the bulk of the S&P 500's weight — Alphabet, Amazon, Apple, Meta, Microsoft, Nvidia, Tesla — each generate, in aggregate, hundreds of billions of dollars in annual operating cash flow. They are not unprofitable. They are not speculative. They are, however, priced for continued dominance.
A second counter-narrative points to interest rates. Price-to-sales multiples are inversely sensitive to the discount rate applied to future cash flows. The period from 2009 to 2021 coincided with the lowest real interest rates in modern financial history, which mechanically raised the present value of distant earnings. The tightening cycle that began in 2022 compressed those multiples for many of the most rate-sensitive names. The fact that the S&P 500's sales-weighted valuation remains elevated suggests that the market is, in effect, pricing in an eventual return to lower rates — or, alternatively, that the largest constituents have earnings streams durable enough to justify the multiple at any plausible rate.
Both counter-narratives have empirical support. They are not mutually exclusive, but they are not equally reassuring. The first assumes that the largest companies will continue to grow into their valuations; the second assumes that the macro environment will be permissive. Neither assumption is contractually guaranteed.
The structural frame
What the Two Majors figure actually describes is the convergence of two structural shifts. The first is the rise of platform economics: businesses in which the marginal cost of serving an additional customer approaches zero, in which data accumulates as an input rather than a by-product, and in which the addressable market is global from day one. These businesses can plausibly support sales multiples that an industrial-era analyst would have dismissed as fantasy, because the underlying economics are not industrial-era economics.
The second is the rise of passive investing as the dominant vehicle for household equity exposure in the United States. When the typical retail investor's exposure to the S&P 500 is via a fund that holds every constituent in proportion to its market capitalisation, the act of investing becomes indistinguishable from the act of buying more of the largest, most expensive names. The index is no longer a measurement of the market; it is a mechanism that shapes the market. The 51% figure is, in part, a measurement of that reflexive loop.
This is not a counsel of despair. The largest constituents of the index remain among the most cash-generative businesses in the history of capitalism. But it is a counsel of caution: the headline number that Americans see when they check their retirement account balance reflects, in significant part, the multiple expansion of a small group of companies whose continued growth is the implicit assumption beneath the entire structure.
Stakes and what to watch
The near-term question is whether the multiple holds. The medium-term question is whether the largest constituents grow into it. The long-term question is what happens to household wealth — concentrated, by index design, in a handful of names — if either assumption fails.
The honest answer is that the sources do not specify. The Two Majors figure is a single data point, posted to a Telegram channel with no underlying methodology disclosed. It is consistent with widely reported observations about index concentration, but a single statistic, however arresting, is not a thesis. What it does is sharpen the question. When more than half of an index's value sits in stocks trading above 10x sales, the index is no longer a representative cross-section of the economy. It is a bet on a particular theory of how the economy will evolve. The market is, in the most literal sense, priced for the future. The only question is whose future.
This article draws on a single wire item from the Telegram channel Two Majors, dated 8 June 2026. The channel did not disclose its data source, methodology, or the precise date of the underlying market data. Monexus has not independently verified the 51% figure against index provider data and treats it as a credible but unconfirmed observation.
Wire provenance
This editorial synthesis draws on the following public wire/social posts:
- https://t.me/two_majors