Bitcoin's ETF Streak Breaks at $201.8M, but the Real Story Is ETH's Quiet Run
Spot Bitcoin ETFs shed $201.8 million on Friday, snapping a nine-day inflow run. Ether funds, by contrast, just logged their tenth straight day of net inflows. The rotation under the surface is doing more work than the headline.
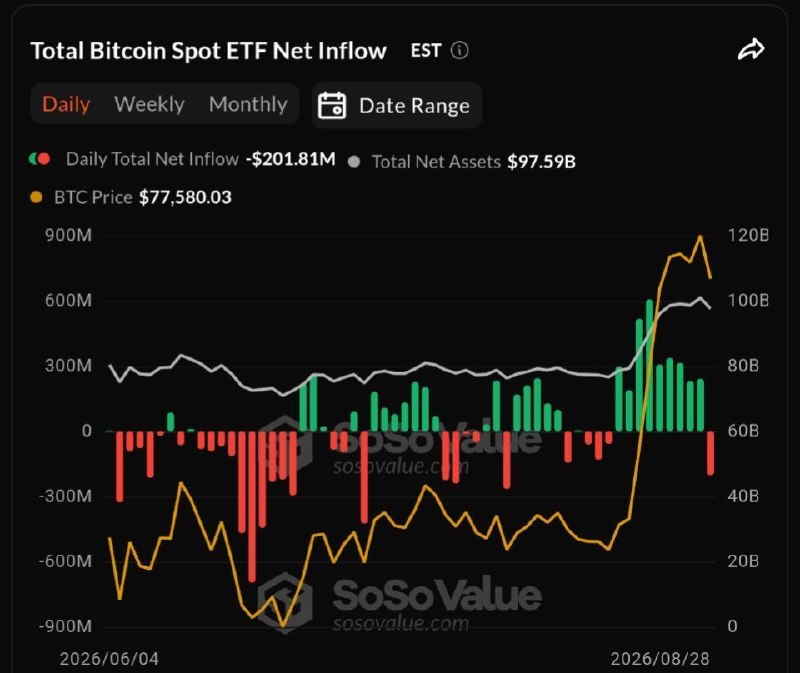
US spot Bitcoin ETFs bled $201.8 million on Friday 28 August 2026, ending a nine-day streak of net inflows and dragging total fund assets back below the $100 billion mark. According to Cointelegraph's market desk, the outflows were led by ARK 21Shares. By Saturday morning UTC, Bitcoin had slipped below $78,000, a level that put pressure on leveraged positions across the market.
Earlier in the same 24-hour window, on 28 August at 16:41 UTC, Cointelegraph's markets desk had separately reported that crypto traders lost roughly $220 million in the past hour, mostly from long positions. Monexus analysis: read in isolation, that liquidation print looks like a stand-alone event. Read against the Friday ETF outflow and the Saturday sub-$78,000 print, it reads as the leveraged tail of a rotation that started unwinding before the ETF tape confirmed it.
The headline number is the streak break. The more durable signal sits one floor up in the same ETF complex.
The streak that wasn't broad-based
For most of August, the ETF complex carried a single story: money coming back into Bitcoin. The Friday break interrupts that read, but it does not overturn it. A nine-day run is short by historical standards; what mattered was the direction of travel, and the direction of travel was positive into Thursday's close.
The cleaner signal sits elsewhere. Ether ETFs have now logged ten consecutive sessions of net inflows, a streak Cointelegraph's markets desk flagged on 29 August at 06:23 UTC. That divergence is unusual. In most of the spot-ETF era, Bitcoin and Ether fund flows have moved together, with Ether amplifying Bitcoin's tape rather than offsetting it. A session in which money leaves BTC products and enters ETH products suggests allocators are making relative-value calls, not panic-selling crypto exposure wholesale.
The earlier tell sat on a different screen. On 27 August at 17:46 UTC, Cointelegraph relayed a CryptoQuant analyst's note that Bitcoin's Coinbase premium had turned positive for the first time in 40 days, a signal of renewed US demand. Friday's outflow is, on the available evidence, a partial unwind of that trade rather than a reversal of the underlying thesis.
Goldman, Solana, and the other tape
Beyond Bitcoin and Ether, the institutional map keeps thickening. Cointelegraph reported on 28 August at 16:36 UTC that Goldman Sachs is now the largest known holder of spot Solana ETFs, with approximately $88.1 million in exposure according to 13F filings. A bulge-bracket US bank sitting on the largest disclosed stack of a product that has traded for only a matter of months is, on its own, a structural story. It suggests the Solana complex has cleared the basic compliance and custody hurdles institutions require before they sign the paperwork.
Read together, the three data points describe a market that is broadening even as its headline asset softens. ETF flows are no longer a single-Bitcoin story. Ether is pulling in capital. Solana is attracting the largest disclosed institutional holder. The long tail of altcoin products is collecting allocations that, two years ago, would have stayed in venture-style structures. The $78,000 print on Bitcoin is the visible event; the quieter rotation underneath is the actual one.
Counterpoint: flows follow price, not the other way around
The case against reading too much into the ETF tape is straightforward. Spot ETF flows are backward-looking. Allocators respond to prints; they do not cause them. A $201.8 million outflow after Bitcoin slips below $78,000 may simply describe risk-off behaviour, not a thesis. The ETH inflow streak could end the moment Ether itself rolls over. The disclosed Goldman position was built at prices that may not survive a deeper drawdown in the underlying Solana token.
This reading is plausible, but it underweights the structural change. Two years into the spot-ETF era, the allocators are not the same pool of capital that drove the 2021 cycle. They are registered investment advisers, bank treasuries, and model-portfolio platforms with quarterly rebalance windows. Their flows are stickier, slower, and less price-sensitive than the retail margin that produced the 28 August long-liquidations.
Monexus assessment: the Friday outflow is a pause, not a thesis change. The ETH streak and the Goldman Solana disclosure are the more durable reads.
What to watch into September
Three signals will determine whether Friday was a wobble or the start of a deeper unwind. First, whether Monday's ETF tape restores net inflows or compounds Friday's outflows. Second, whether Ether's streak survives its eleventh session; a break would suggest the rotation thesis is fragile. Third, the next round of 13F disclosures in mid-October, which will reveal whether the Goldman Solana position is an outlier or the leading edge of broader bank exposure.
Each of those signals is dated and binary. None requires reading the institutional tea leaves or waiting for a Fed pivot. The next few weeks of price action will resolve them.
Desk note: Monexus framed this piece around the flow divergence between Bitcoin and Ether products rather than the single $78,000 print, because the underlying source items describe both a streak break and a streak continuation. The 28 August long-liquidation alert and the Saturday sub-$78,000 print were treated as adjacent events in the same unwind rather than as a single causal sequence, since the Telegram alert predates the BTC slide below $78,000. The Goldman 13F filing and the Coinbase-premium signal were treated as separate structural data points rather than narrative props.
Wire provenance
This editorial synthesis draws on the following public wire/social posts:
- https://cointelegraph.com/markets/bitcoin-etf-end-9-day-inflow-streak-btc-below-78k
- https://www.investing.com/news/cryptocurrency-news/bitcoin-price-slips-below-78000-as-digital-gold-narrative-faces-fresh-test-4881960
- https://t.me/Cointelegraph/71831
- https://t.me/Cointelegraph/71830
- https://t.me/Cointelegraph/71828
- https://t.me/Cointelegraph/71818
- https://cointelegraph.com/markets/bitcoin-etf-end-9-day-inflow-streak-btc-below-78k
- https://www.investing.com/news/cryptocurrency-news/bitcoin-price-slips-below-78000-as-digital-gold-narrative-faces-fresh-test-4881960
- https://t.me/Cointelegraph/71831
- https://t.me/Cointelegraph/71830
- https://t.me/Cointelegraph/71828
- https://t.me/Cointelegraph/71818